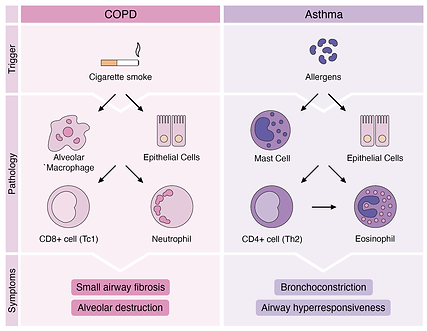
2024/ PATHOPHYSIOLOGY OF ASTHMA
Making medical diagrams reader-friendly.


About the Project:
I had the privilege of being commissioned by a University of Technology Sydney researcher to create a series of diagrams to explain the pathophysiology processes involved in asthma and COPD.
Tools:
- Adobe Illustrator
- Sketching
Project Partner:
Datsyuk, Jessica Katrine
(BAdvSc, M. Pharmacy)
Timeframe:
1 week + revisions
Why the unusual partnership?
Medical research is often complex, heavily detailed and requires excellent rigour. For better digestion, insights are usually summarized into scannable, shareable figures. To create a set of medical research reviews that were both accurate and digestible, Jessica reached out to me to make use of my data visualisation skills.
01 / IDEATION STAGE:
How did I get my head around pharmacology?
It was a simple conversation. Jessica and I met, and she went into depth about her area of research, sparing no detail. Diving deep into the processes, she also provided me with a few puzzle pieces - similar diagrams on the topic.
Armed with the new knowledge and examples, I provided clean, black-and-white drafts for her approval, as well as a proposed colour scheme.


02 / DELIVERABLE STAGE:
What did I come up with?
With approvals in place, I was able to provide the three, full-colour diagrams she needed. Each one was designed with readability and context in mind.


03 / THE ENCORE:
This is a live, ongoing partnership.
After the first set of diagrams successfully contributed to the publishing of the paper, Jessica reached out again, with a request for more work. This time around, the diagrams were far more technical, the balance of accuracy and readability far more delicate. These diagrams are intended for another, similar paper, which is still under works.

